Introducing the New Executive Dashboard in InTempo MX
 Faith Kubicki
For rental companies to successfully use telematics for more than just a “dot on a map”, they need a way to turn their machine data into fast, actionable insights. The new Executive Dashboard in InTempo MX gives teams a clear, high-level view of what matters most—without repeatedly creating the same reports or jumping between screens. It’s a centralized snapshot of operational health, asset utilization, and risk areas, with the ability to drill down when action is needed.
A True At-A-Glance Overview
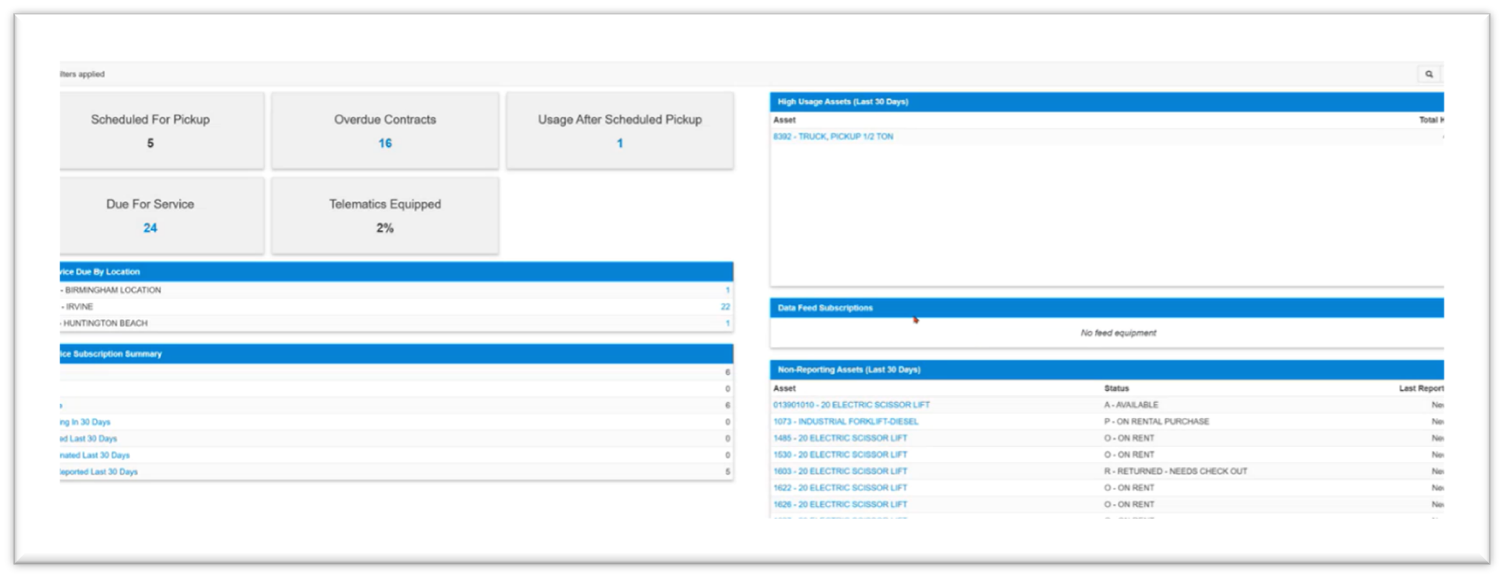
On the new Executive Dashboard, you’re immediately presented with key operational indicators, including:
- Upcoming pickups – Equipment scheduled for pickup, helping teams stay ahead of logistics.
- Overdue contracts – Assets that should have been returned but haven’t, with one click access to the underlying details.
- Assets being used after their scheduled pickup – Equipment running outside of the expected times, signaling potential billing opportunities.
- Due for service equipment – All machines that need preventive maintenance, routine inspections, or larger repairs.
Drill Down from Summary to Asset Detail
The dashboard isn’t just a static snapshot – it’s a launch point. From any alert or summary, drill into individual assets to view:
- Current status and location
- Rental customer and contact information
- Usage history by day or hour
- Service status, including time-based or meter-based maintenance thresholds
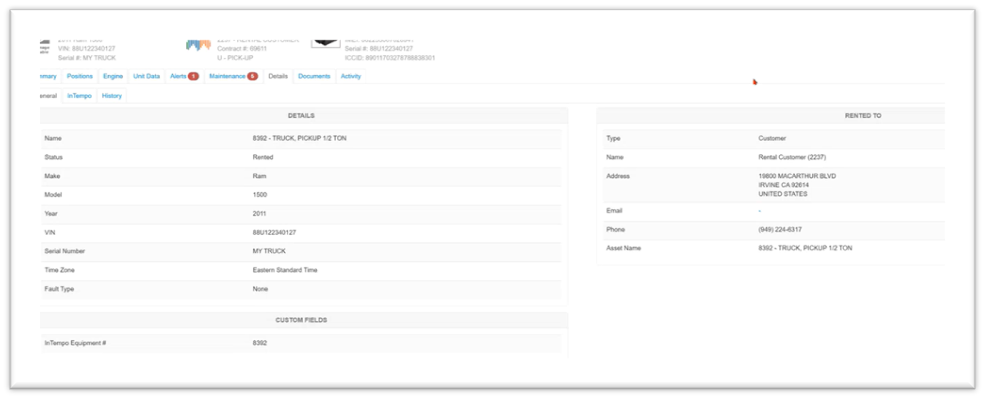
For example, if an asset has continued to accumulate hours after being flagged for pickup, you can see exactly when and how it was used. You can then follow up with the customer in accordance with company policy.
Subscription and Reporting Awareness
The dashboard also includes visibility into device and data-related activity, such as:
- Active and expiring device subscriptions
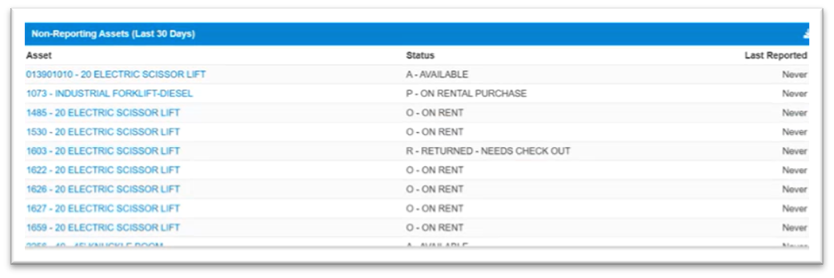
- Devices that aren’t reporting back data as expected
- Total telematics coverage for your entire rental fleet
This helps teams quickly identify gaps in reporting or connectivity without running separate audits.
One Screen. Fewer Surprises.
The goal of the Executive Dashboard is simple: reduce surprises, surface risk early, and make it easier for leaders to stay informed without spending all day in the system.
It’s not about more data; it’s about seeing the right data at the right time and acting on it quickly.
For a deeper look at integrated telematics for your organization, contact us today.