Making the Most of Equipment Analytics: How to Close the Gap Between Data and Business Value
![]() Tony Tye
Tony Tye
Every analytics system promises to unlock the data you need to improve your business. And they aren’t wrong; modern equipment rental software can collect and track nearly any metric, from days on rent to dollar utilization for your entire fleet.
But here’s the thing: data and insights aren’t synonyms.
Turning data into insights – and insights into action - takes work. Let’s take a deeper look.
The Difference Between Data, Information, and Insights
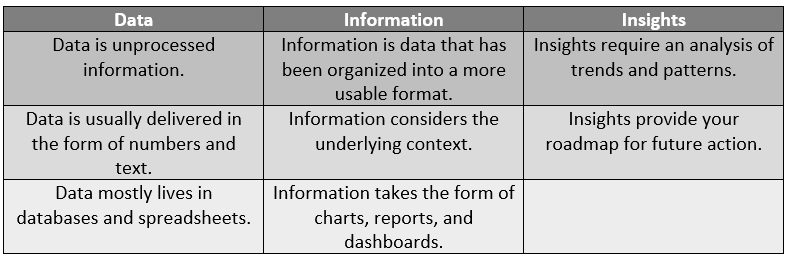
When you convert your data into information and your information into insights, you set the stage for accurate, timely, and well-informed decisions.
Is Your Data Relevant?
Data can be extremely relevant to one person and meaningless to another.
Your Chief Financial Officer likely cares very much about your profit margin and your Days Sales Outstanding (DSO); your Rental Coordinator may not care about these analytics at all. Your Service Manager may live and die by uptime and first-time fix statistics, while showing your Sales Manager these KPIs does nothing for your business.
In order to be actionable, your insights need to be made available to the right person at the right time in the right setting. If you can’t achieve this, your equipment analytics program delivers no value.
Is Your Data Delivered in a Timely Manner?
Data needs to be delivered in a timely manner to be relevant.
Last month’s sales numbers can’t help you hit this month’s targets.
Last quarter’s utilization rates don’t matter much today if you have a heavily seasonal fleet.
Last year’s maintenance-to-income ratio isn’t helpful now if you’ve sold off some of your older, more breakdown-prone assets.
If your decision-makers don’t get the information they need during the narrow window of time they have to act on it, your equipment analytics program isn’t meaningfully improving your business. If your data remains trapped in a spreadsheet, information is sent to a platform that’s never accessed, or you simply don’t have the time to collect data from three different applications and arrange it in a meaningful way, the insights you could have gained may never truly be unlocked. This is why many rental businesses struggle to cut through the noise and get a measurable return on their Big Data investments.
The Value is in the Details
Information needs to be detailed and specific for it to translate into valuable insight. For instance, seeing revenue spike in a particular month is one thing – but without understanding the context behind it, you can’t make a fully informed decision to capitalize on the trend.
If you don’t have the insights that explain why you got to a specific piece of information, it can’t be acted on in any meaningful or scalable way.
Pay Special Attention to Anomalies
When you have so much data and so little time, focusing on exceptions can bring more value than the “same old, same old.”
The first time you see an interesting variable, it’s time to take a deep dive. For instance, if a customer that typically has 10+ open equipment rental contracts suddenly drops to two, it’s well worth a call to make sure you’re appropriately meeting their needs.
Here’s where – especially for smaller independent rental companies – a successful analytics program can make a major impact. Your customers aren’t just one of a million; your machines aren’t just one in a fleet of hundreds of thousands. You’re nimble enough to respond to abnormalities as they arise, making a meaningful impact on your business.
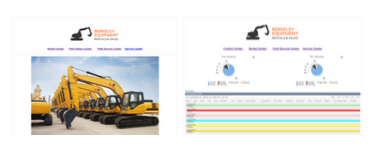
Use Visualization to Deliver Data in a More Accessible Way
Everyone is busy. Who has the time to step away from their “normal” job responsibilities to pore through complex spreadsheets?
If your people don't clearly understand the information they are being given, there are no insights to be gained. Similarly, poor delivery of information can cause the insight to be overlooked altogether.
Visualization methods (think charts, graphs, maps, and dashboards) are key for putting your equipment analytics into context. For instance, month-over-month, quarter-over-quarter, and year-over-year statistics that are plotted out on a chart are more easily understood and correctly interpreted than cells in a spreadsheet. From there, it’s much easier to spot the anomalies that we just discussed.
The Bottom Line
A successful equipment analytics program can yield powerful returns for your company. You can:
- Reduce your operating expenses
- Increase revenue and profits
- Get more strategic when you add to – or sell off assets from – your fleet
- Create more accurate forecasts
- Respond to market shifts and changes in demand
However, any insight – powerful as it may be when used for good – is absolutely useless if you don't choose to use it. As your build your analytics program, make sure you’re delivering relevant information in an understandable way, then empowering the recipients to take timely action.
Build a Better Rental Business with Intelligent Equipment Analytics
At InTempo, our entire product suite is designed to deliver the right information to the right people at the right time. Reporter puts your data in context; helps you spot exceptions without having to manually review routine reports; and pairs unique data sets to give context to your trends. MX pairs your rental data with telematics data, providing even richer insights for better decision-making.
Interested in learning more? Request a demo here or contact us for more information.