Operational Reports and Cost-Cutting Rental Reports: Solving Reporting Challenges Part Three
![]() InTempo Software
InTempo Software
Your data is the foundation for improving operations, reducing your operating costs, and driving profits. But: how can you get that data out of your rental software and turn it into actionable insights?
In Part Two of our reporting series, we highlighted four main areas that you need to understand in order to build a strong reporting system for your rental business. Those areas are:
1. Understanding what reports you need to provide
2. Understanding what data you have available for the reports
3. Understanding how to transform your data to the proper format and summary levels required
4. Understanding how your users need to consume the reports
In this post, we’ll explore the third critical component: transforming and summarizing your data to create reports your team can actually use.
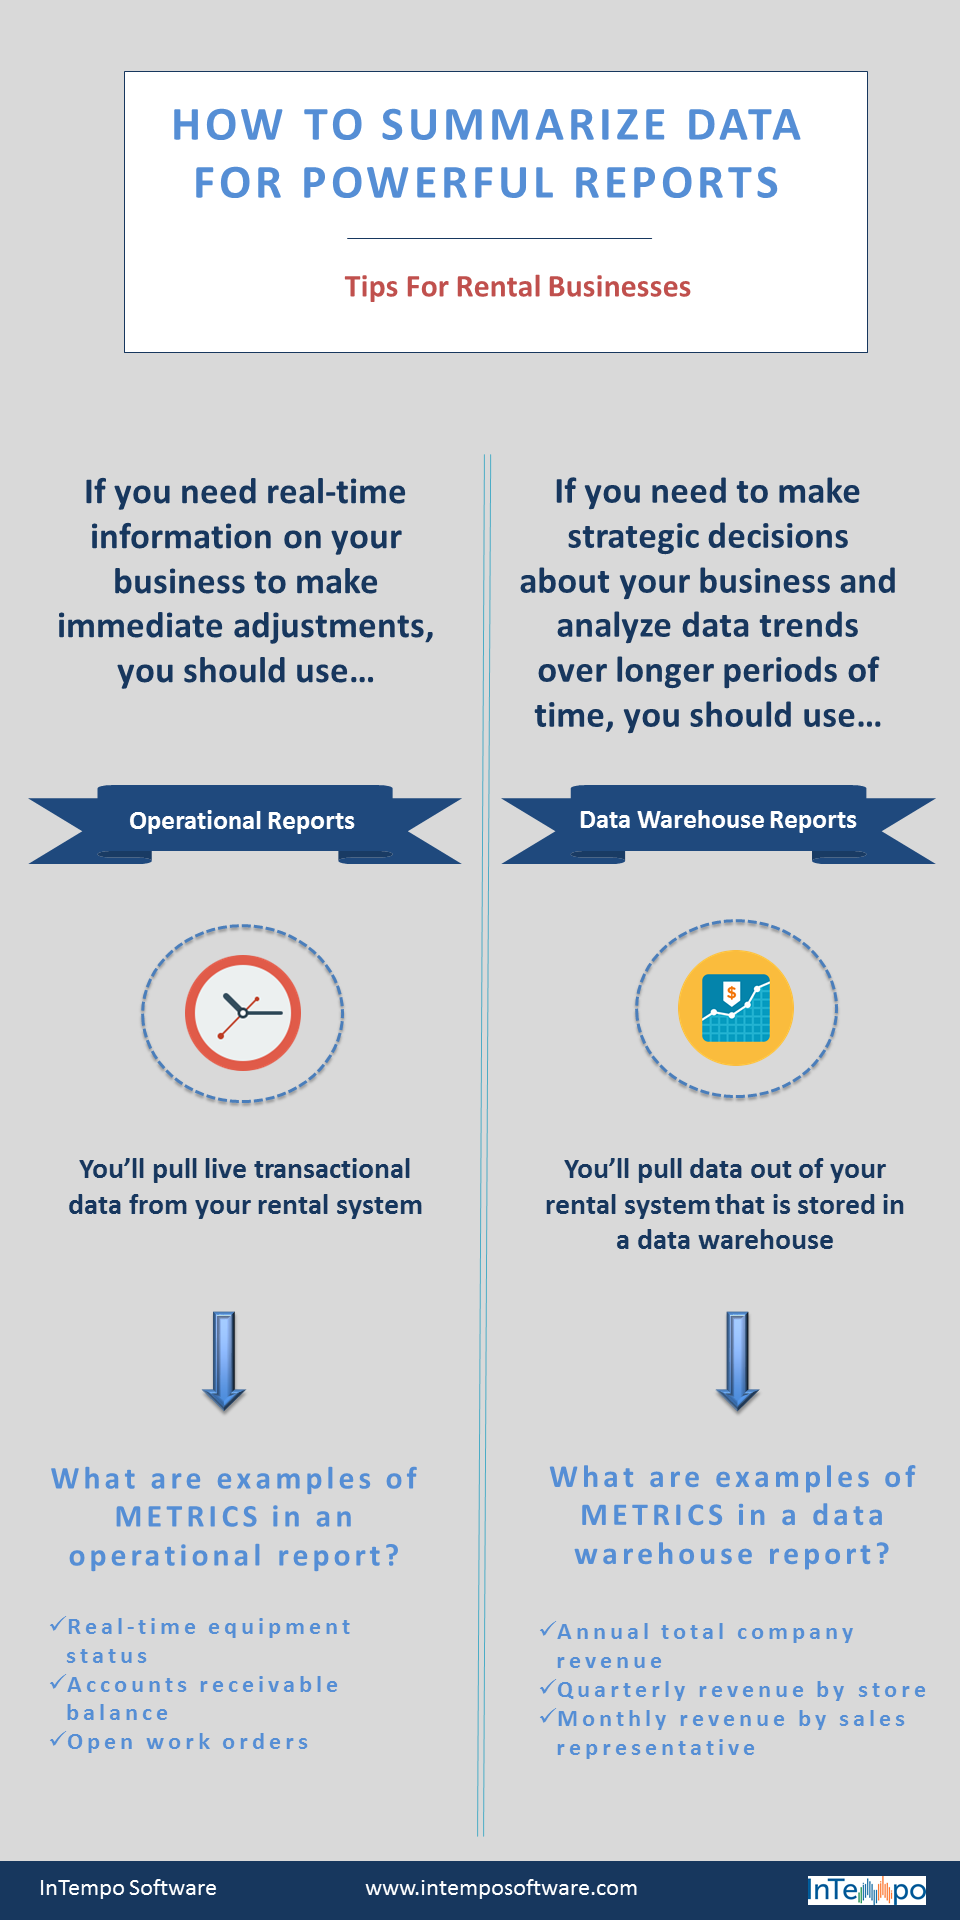
Operational Reports vs. Data Warehouse Reports
Most of your rental reports can fall under one of two main categories – operational reports or data warehouse reports.
Operational Reports
Operational reports are generally based on live transactional data from your rental ERP. This includes reports on equipment statuses, accounts receivable balances, or open work orders. Here, you need near-real-time data to help your team complete day-to-day tasks. These operational reports provide information that can help you identify problems or monitor day-to-day operations. While some of these reports may cover weekly, monthly, or even quarterly performance, you’ll often want to focus on a particular day or hour.
Data Warehouse Reports
On the other hand, data warehouse reports generally present data in a way that enables you to make strategic decisions for the long-term success of your business.
Data is pulled out of your rental software on a periodic basis and stored in a data warehouse. The data is typically pulled nightly, and certain measures are summarized up along several key dimensions. For example, revenue may be summarized by total company, by location, by sales rep and by customer, or possibly any combination of these different dimensions. Additionally, data is usually summarized by various time dimensions – daily, monthly, quarterly, yearly or byspecific fiscal periods.
Data warehouse reports are better suited to allow you to see trends across time. (For instance, they're great for comparing this year's actual expenses to budget numbers or to prior-year spending.) Many of your key strategic metrics and dashboards should be built from data warehouse reports and data.
Several different tools exist to help you create the right reports for your rental business.
As with most things in the business world, there is never a single answer as to whether your company needs tools to support one or both of these types of reporting. You can potentially build many of the reports that your business needs using either operational or data warehouse reporting tools, but as a general rule: specific reporting tools are better suited for one or the other type of reporting.
Operational reporting tools tend to be more common and less expensive than full-blown data warehouse reporting systems. Many smaller companies can be successful with only operational reporting capabilities, while most larger companies will utilize both types of reporting tools to help provide the full scope of metrics and reporting needs throughout their organization. This is why it is important to go through the first two steps outlined in previous posts in order to properly identify your needs.
In the next post, we’ll show you why it’s critical to understand how the users in your organization will fully utilize the reports you have created.
Written by Chris Kennedy, an InTempo Project Manager and reporting expert.