Using Dashboards for Data Transparency
![]() InTempo Software
InTempo Software
If you've got big goals for your rental business, reporting on key metrics is the first step in achieving them. However, you can only go so far when your data is only seen and used by upper management.
When you make your day-to-day data accessible your to rental coordinators, mechanics, accountants, and salespeople, it can be a game-changer. When employees “on the floor” know how they are performing and can clearly see their tasks ahead for the day, they are empowered to work more efficiently. Though it is cliché, this translates into a better experience for employees and customers alike.
But what does this idea of data transparency and accessibility look like in real life?
Here's a behind-the-scenes look at some of the custom dashboards we've built for one of our customers, Craneworks.
A Data-Driven "Control Center" for Day-to-Day Rental Operations
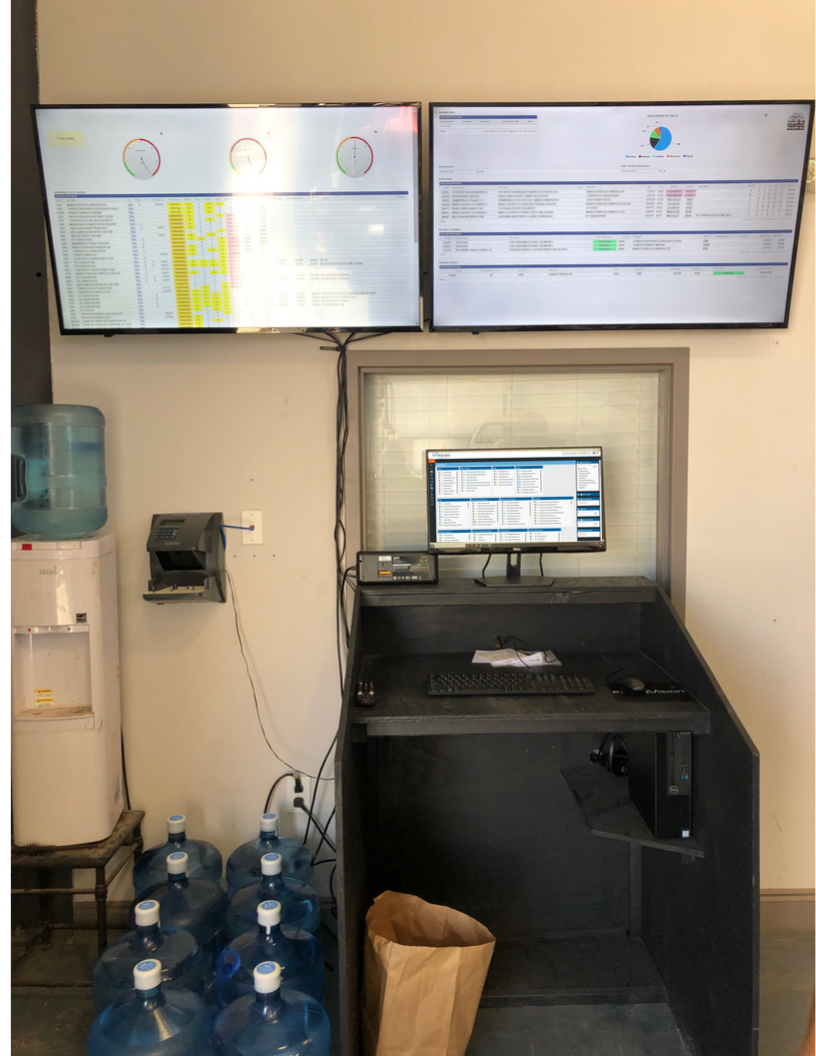
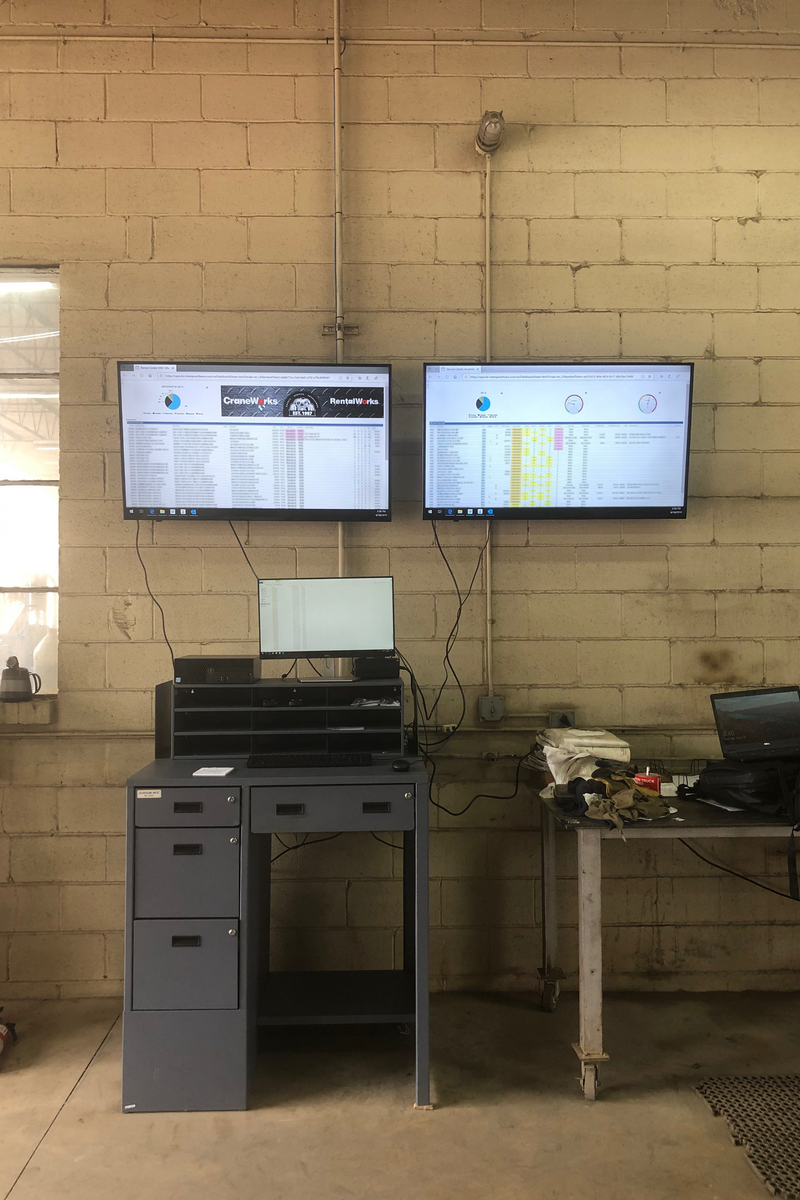
Here's an example of a rental "Control Center" that puts Craneworks' most important information front and center. These dashboards pull real-time updates directly from the company's rental software. We streamlined the data so only the metrics that matter are included. Now, Craneworks can display those dashboards on large monitors behind the counter, in the shop, and elsewhere throughout their stores to keep all their employees working toward their high-level goals.
Custom Dashboards for Your Rental Business
Let's take a deeper look at the process of building these dashboards.
First and foremost: we can customize the home screen with your rental company's logo and branding:
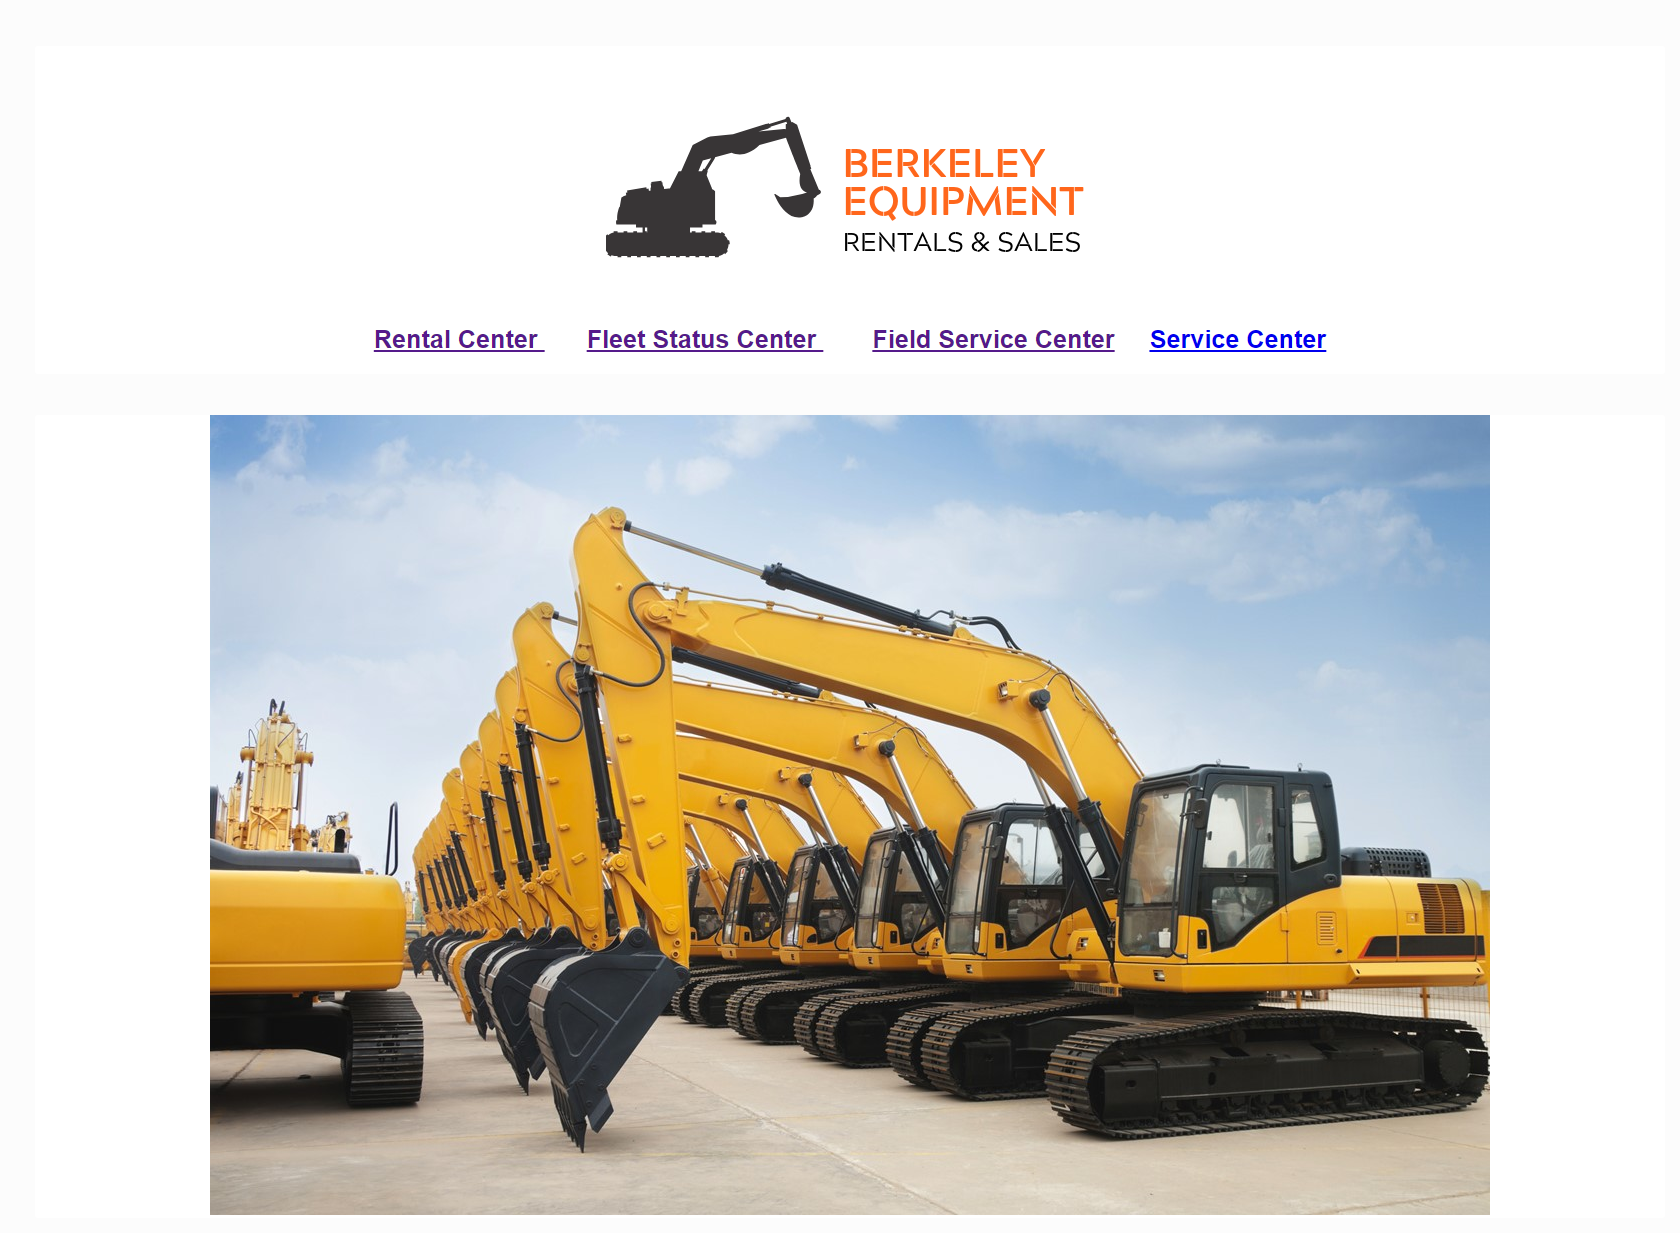
From your home page, you can link to multiple reports and dashboards. If your company has multiple locations, you can also set up different versions for each branch.
The Rental Center Dashboard
The primary dashboard shows reservations, exchanges, and pickups, as well as OEC%:
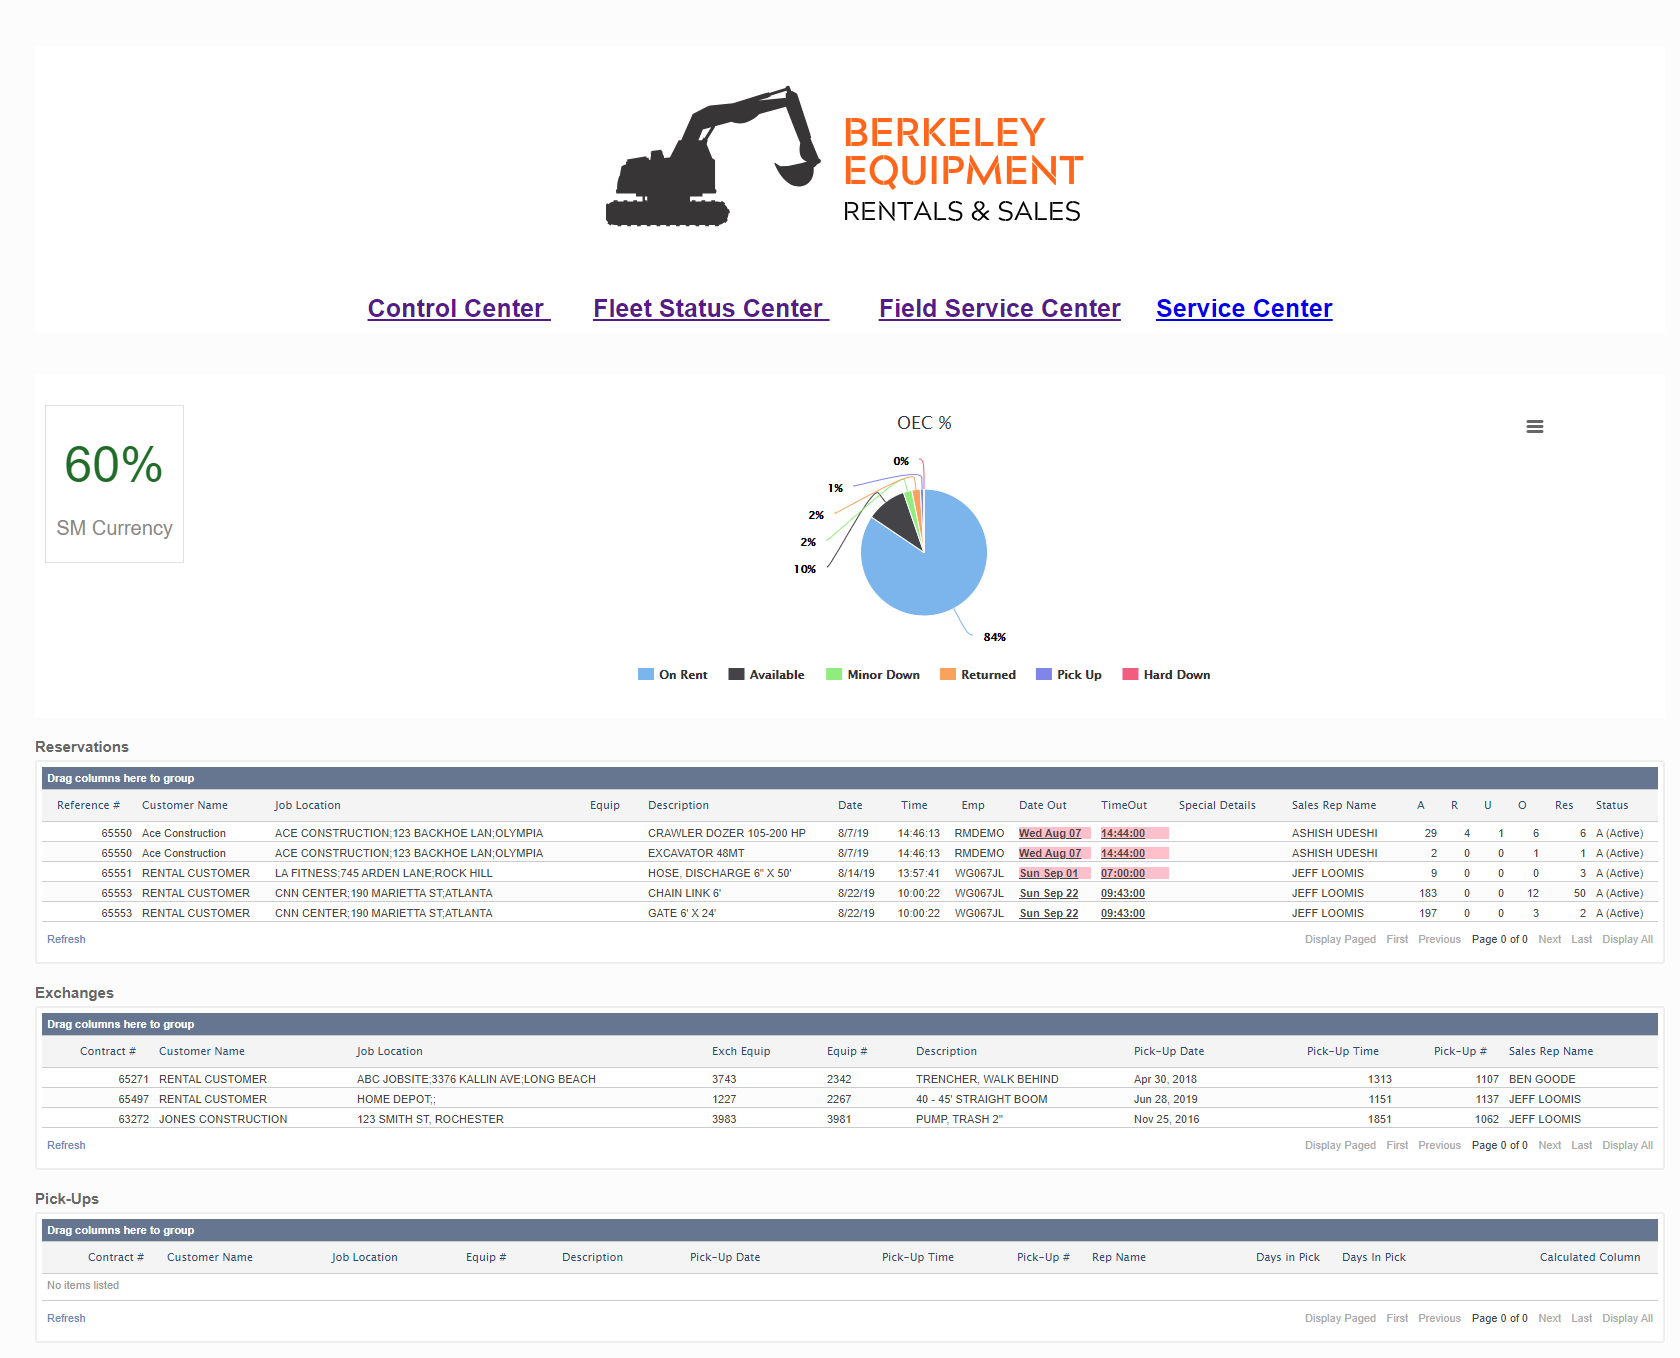
The top chart provides an at-a-glance look at equipment by status. Below this is a list of upcoming reservations, exchanges, and pickups. Our customers use this to show their rental counter and operations coordinators what to focus on. The color shading shows reservations that have a date and time out within two hours of the current time. This helps rental coordinators prioritize their orders.
The Fleet Status Dashboard
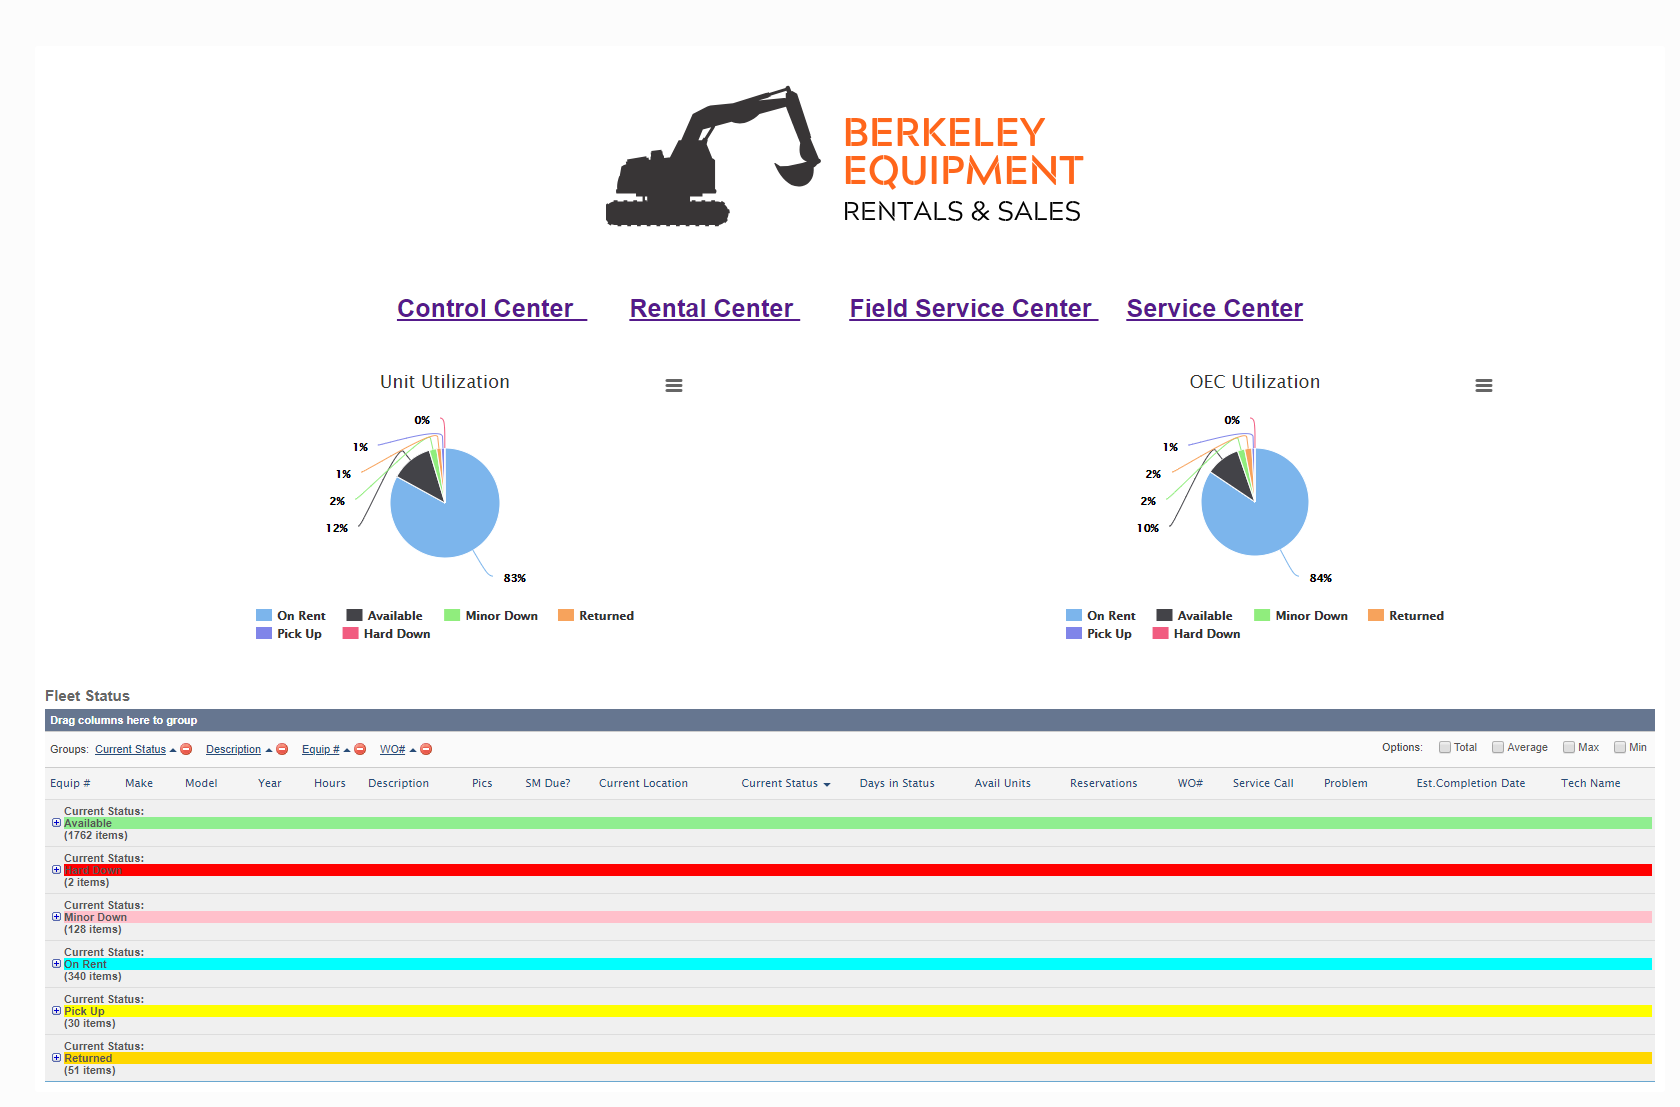
In addition to utilization stats, this dashboard provides management with easy-to-digest information on their equipment. It can be company-wide and then broken down by each location. You can click the plus sign to expand to see equipment in each status. The “pics” field links to a Google drive containing photos documenting equipment condition.
The Field Service Log
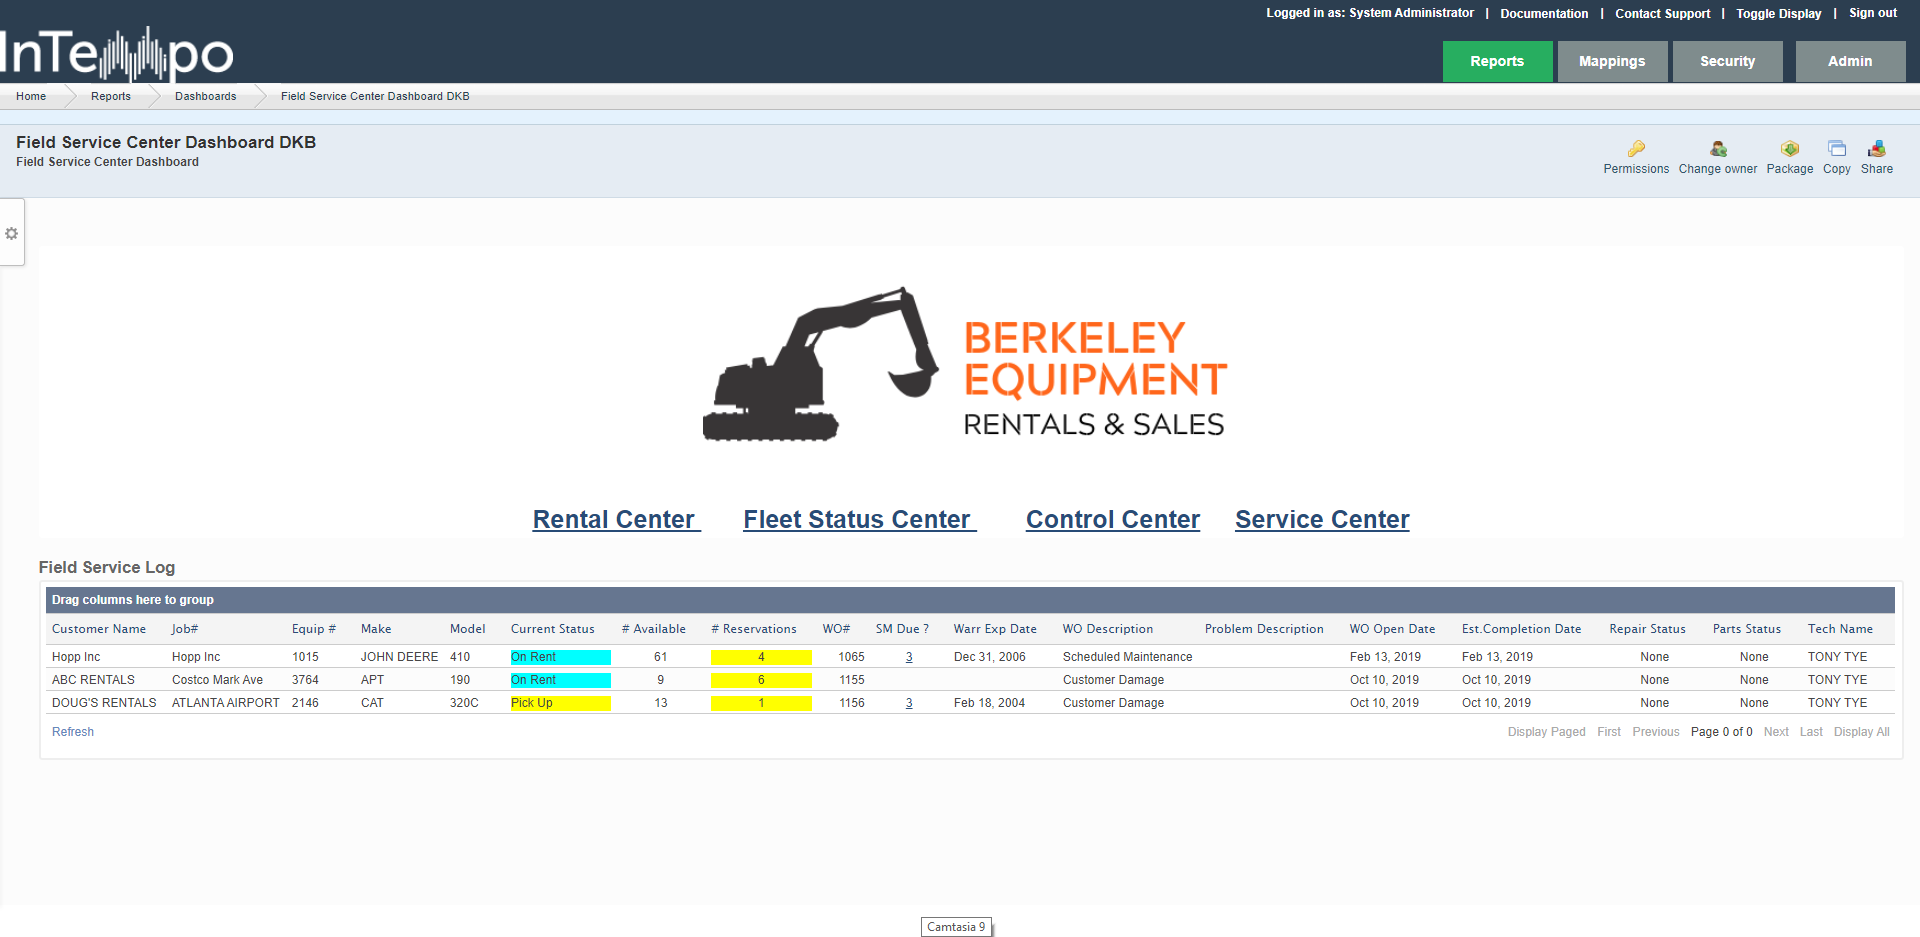
This shows field mechanics the information they need to prioritize which machines to service along with the work order information and the customer information the equipment is on rent to.
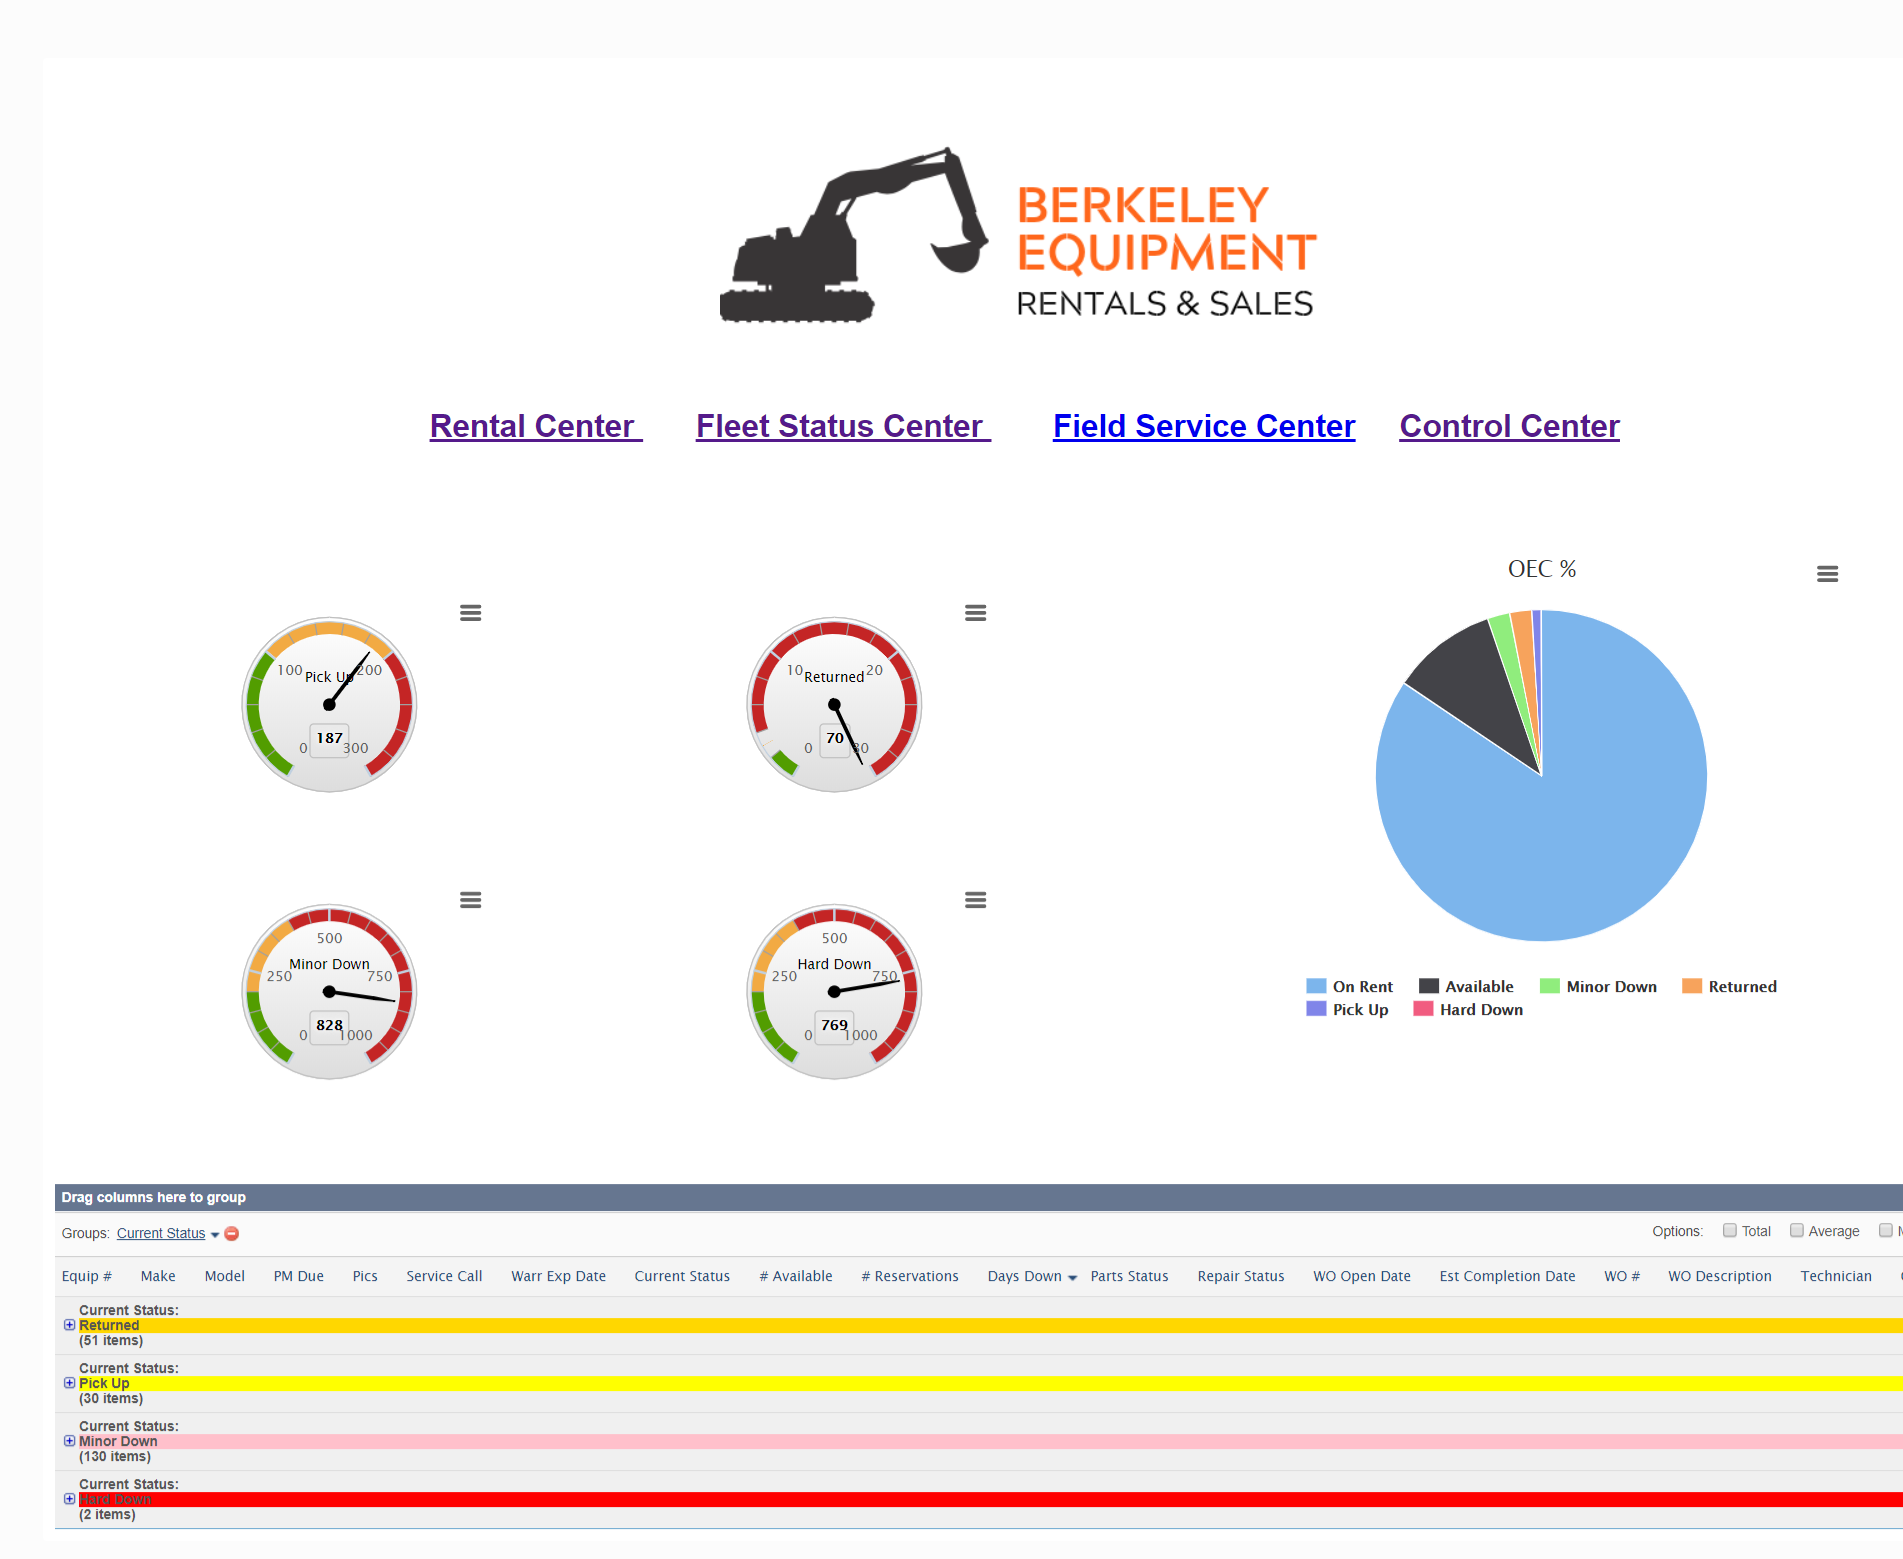
The Service Center Dashboard
This dashboard can be set up on large screens in the shop so it's easy for mechanics to prioritize their work.
Together, these dashboards provide crucial information not just for management, but also for rental coordinators and mechanics.
If you’re interested in learning how InTempo can customize dashboards for your rental business, contact us today.